# Round numbers
round(14.9858187509,3)14.986Introduction to the Class - Math Self Assessment
Email: joanna_bieri@redlands.edu
Office Hours take place in Duke 209 unless otherwise noted – Office Hours Schedule
Class Website:
If you want to do data science or generally understand trends in the world (mathematical modeling), then one of the best things you can do I get good at a few important areas of mathematics. Data science is a discipline that sits between math and computer science with applications in almost any discipline (Art, Medicine, Engineering, Business, Economics, etc). How much math you need to know depends on what type of Data Science you want to do.
The goal of this class is to go over some important areas of mathematics AND to show how to us Python programming to interact with and better understand mathematical ideas. I am expecting that everyone in the class is somewhat comfortable with high school math, but maybe needs some review. Some of the topics we cover might be review for you and some of the topics might be brand new.
Here are some things we will cover:
We will just do a overview of topics and focus on interpretation of results. For a deeper, more theoretical, understanding of any of these topics I strongly recommend a minor in Mathematics:
Take: MATH 121, 122, 221, 241, 311, 312.
From: https://www.multiverse.io/en-US/blog/how-much-math-data-science
Some consider Linear Algebra the mathematics of data and the foundation of machine learning. Data Scientists manipulate and analyze raw data through matrices, rows, and columns of numbers or data points.
Datasets usually take the form of matrices. Data Scientists store and manipulate data inside them and they use linear algebra during the process. For example, linear algebra is a core component of data preprocessing. It’s the process of organizing raw data so that it can be read and understood by machines.
At a minimum, Data Scientists should know Matrices and Vectors and how to apply linear algebra principles to solve data problems.
Data Scientists use calculus to analyze rates of change and relationships within datasets. These math skills help them understand how a change in one variable — such as changing customer preferences — affects another variable, like sales revenue.
Before you begin your data science journey, you should master the two main branches of calculus: differential and integral.
Differential calculus studies how quickly quantities change. Data Scientists should learn its foundational concepts, including limits and derivatives. Python libraries like NumPy and SymPy can speed up this learning process by performing complex calculations efficiently.
Data professionals apply differential calculus to optimize machine learning models and functions. For instance, gradient descent calculates the error between the predicted and actual results. This method allows neural networks and other types of algorithms to adjust their parameters iteratively, reducing errors and improving performance.
Integral calculus analyzes the accumulation of quantities over a specific integral. To effectively apply this technique, you must understand definite and indefinite integrals. Familiarity with Python libraries like SciPy can also help you calculate integrals.
Data professionals use this branch of mathematics to solve many problems in data science, such as forecasting the demand for a product and analyzing revenue. Machine learning algorithms also use integral calculus to calculate probability and variance.
Probability and statistics go hand in hand. Data professionals use these mathematical foundations to analyze information and forecast events.
Statistics is the branch of mathematics that collects and analyzes large data sets to extract meaningful insights from them. Data Scientists use statistics to:
Collect, review, analyze, and form insights from data Identify and translate data patterns into actionable business insights Answer questions by creating experiments, analyzing and interpreting datasets Understand machine learning and predictive models Here are a few examples of statistics principles you’ll need to know to break into the data science field:
Descriptive statistics - Analyzes a dataset to summarize its main characteristics, like mean and mode Inferential statistics - Extrapolates from known data to make predictions or generalizations about a larger population Linear regression - Predicts the relationship between an dependent variable and two or more independent variables Statistical experiments - Know how to create statistical hypotheses, do A/B testing and other experiments, and form conclusions
In contrast, probability is the likelihood that an event will occur. Data professionals use this method to analyze risk, forecast trends, and predict the outcomes of business decisions.
Data Scientists need to know these basics of probability:
Keep in mind that how much math you need to know may also depend on your role. For example, a junior Data Analyst focuses more on analyzing trends. Although they still need to know how to extract data and interpret information, they work less with complex mathematical concepts. Unless they need to work with machine learning algorithms, they’ll use math for data science less than a senior-level Data Scientist.
An important goal of this class is to give you the confidence to learn/review math on your own. It is totally okay to forget math that you learned in the past! It is totally okay to be completely confused by something that you learned in middle school! What is NOT okay is to give up :)
This class should be a safe place for exploring and learning mathematical ideas. It is everyone’s job to ask and generously respond to questions.
Below is a list of problems to help you assess where you might new more review. Attempt each of the problems - then look at the answers below. Make a note of a few things:
Rounding and Significant Figures:
Application Problems
Fractions and percents
Algebra
Geometry and Trigonometry
We are going to use Python like a graphing calculator: to do some of the more tedious calculations for us and to show graphs and interact with applications. Here are some things it can do:
# Round numbers
round(14.9858187509,3)14.986# Add, Subtract, Multiply, Divide
(31+4)*2/(9-1)8.75# Exponents 3^2 = 3**2
3**29# We need packages to do other more complicated things - here are two we will use
# Numbers
import numpy as np
# Symbols
import sympy as sp# Logs
np.log(2)0.6931471805599453# Square roots
np.sqrt(4)2.0# Functions
np.sin(3)0.1411200080598672# Symbols
x = sp.symbols("x")
4*x+3\(\displaystyle 4 x + 3\)
# Solve for 4x+3=0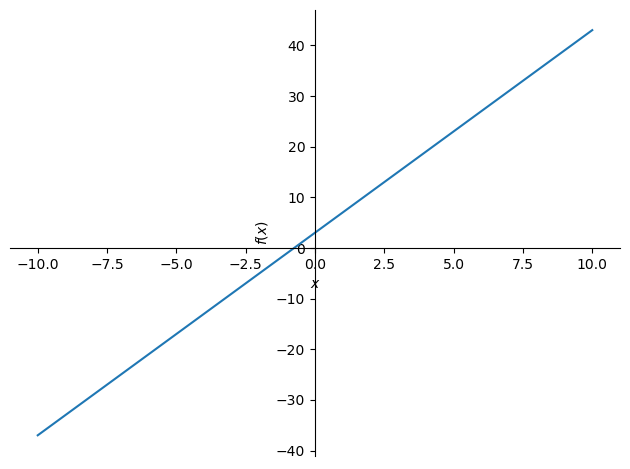
sp.solve(4*x+3,x)[-3/4]# Plot a function
from sympy.plotting import plot
plot(4*x+3)